Pgbench-tools - part I
DAWN OF BENCHMARK
This is a translation of my original post in french for Loxodata - PostgreSQL experts in France
During PgDAY Paris in march of 2017, I was lucky to attend Fabien Coelho’s lecture on benchmarking.
You may find a summary in french here
I was also lucky to attend a lecture from Kaarel Mopel from Cybertec who mentioned pgbench-tools which I had to give a go !
What is it all about ?
pgbench-tools is a tool that automates benchmarking tests.
It works on the well known project pgbench, a tool among the contributions installed with a full installation of PostgreSQL.
Two scripts are used to wrap and make series of tests with pgbench : benchwarmer and runset.
It is also possible to collect statistics both from the OS (CPU, RAM, etc.) and from Postgres (buffercache and checkpoints among other things).
There are also scripts for basic configuration and memory usage monitoring.
If that is not the case, I strongly recommend to get acquainted with pgbench documentation if you are at all interested in benchmarking.
What can pgbench-tools do ?
It makes automated tests based on the different variables that you choose : scale, client, duration of test, “rush hour” rate (as fast as possible) or normal rates (a target of tps). One should never bench with only tps in mind but also latency, and for this option -R (option SETRATES) will reflect the activity on your cluster. It is up to you to find out which rates to apply.
Prerequisites
-
git : with
git clone, you can clone the repository to your local machine. Of course, it is also possible to download the archive in zip format and decompress it. -
GNUplot is used for the creation of graphs. I am afraid there is no substitute.
Installation
First, create database for the bench and for storing the results :
createdb results
createdb pgbench
Then, initialise the database with a script :
psql -f init/resultdb.sql -d results
You should think about using the correct database in the command line, but also in the config file which is fortunately at the root of the folder and filled (very handily) with default values.
At last, create an initial set which is going to be used as a baseline.
./newset 'Initial Config'
Vocubulary words
A set is a series of tests. For a given configuration of pgbench-tools and of the cluster, the tool lauches a benchmark. That way, everything can be categorised.
Scale refers to the size of the database, equally you can sometimes see “scaling factor” in replacement. It is a factor that multiplies the default size of pgbench database.
Transactions per second are abreviated by tps.
The value of client is the number of concurrent access to the database.
Latency is the time the client takes to finish a transaction (commit) and allows to send another query.
The three values avg_latency, max_latency, 90%< : are respectively average latency, maximum latency, and latency of 90th percentile. They describe distribution of latency.
Quick start
The important scripts are :
- newset :
./newsetgives a list of all the sets created ;./newset 'nom_du_test'adds another set to the list.
- runset :
./runsetfires the tests inside a given set ; - config : is the file that contains the necessary informations for the tests. You can edit this with your favourite tool (vim, nano, emacs) :
- contains the connection string ;
- database for the bench (default value is
pgbench) ; - database used to store the results (default value is
results) ; - type of test (script of bench) to launch (details are given further). And directory in which it remains (standard : 8.4 to 9.5 or out of the standard : 8.3 or 9.6 and higher) ;
- scales (défaut : 1, 10, 100, 1000) ;
- number of times test are performed (default 3) ;
- and the device to monitore for OS statistics (default
sda).
- webreport :
./webreportgenerates a reportindex.htmlwith GNUplot graphics. It launches automatically at the end of a set. You can launch it manually if the set you are in is not currently finished and you cannot or do not want to wait.
The report
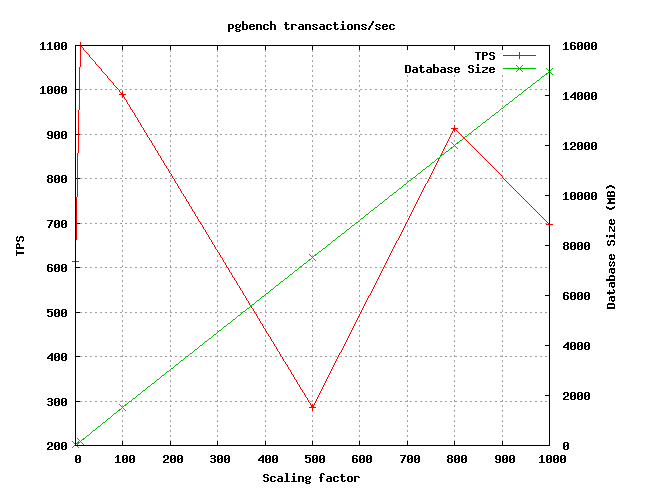
The is first a part with a general view :
- a graph with 2 curves showing tps and size of database depending on scale (carefull this is the average value on all the tests) ;
- a graph with 1 curve showing tps depending on amount of clients (average again) ;
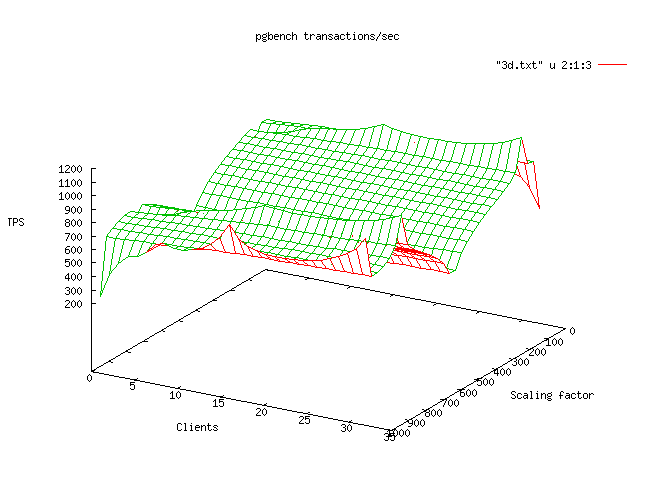
- a 3D graph, showing tps, client and scale ;
- a comparison graph with 1 curve for each set on the same image and showing tps depending on scaling factor and tps depending on client number.
Here are some examples of 2 graphs :
The second part is a more detailed result for each set :
- a first graph tps/db size and scale on the average of each set then a second showing tps/client in the same manner ;
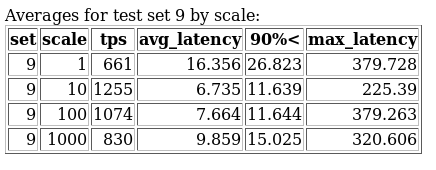
- 2 tables summing up the set : one by scaling factor and the other by client (showing
set,scale,tps,avg_latency,90%\<,max_latency) ; - a summary table by clients, scale and rate limit (
set,scale,clients,rate_limit,tps,avg_latency,90%\<,max_latency) ; - a detailed table with relevant values for each test (
set,test,scale,clients,rate_limit,tps,max_latency,chkpts,buf_check,buf_clean,buf_backend,buf_alloc,max_clean,backend_sync,max_dirty,wal_written,cleanup).
Word of warning
It is important to stick as close as possible to reality to get a practical and meaningful result.
Firstly, I recommend activating archive_mode and fsync as well as backup and wal archiving.
This is all the more important as writes are performed in the WAL folder, in the database, in the former clogs (now XACT) and in the logs (if you have had them activated - if not you definitly should). The writes have an impact on performances during the bench, deactivating those would predjudice the relevance of the results.
With regards to this information, once the bench is fired, WAL files are going to be produced. Lots of files, and I really do mean LOTS OF FILES. You can choose to do a manual purge and stay behind your keyboard the entire time, or provide your server with a huge File System to think ahead of this issue
The original and the forks
The original tool as it has been issued by its author is here.
As far as I am concerned, I stumbled across compatibility issues with PostgreSQL 9.6 at the time of testing (several months ago). It was therefore necessary to update the tool. Indeed, in the version 9.6, generation of random series changed syntax, the scripts were no longer compatible (see documentation).
Here is a link up-to-date with the last bug fixes and new features that I will cover in later posts : here.
When to use it ?
-
It is a perfect choice for comparing all-inclusively changing of a single parameter : Should you wish to better your database’s performances in a general manner : only a handfull of hours should suffice. It is not necessary to test for many scales, or client or tps or anything else. Juste tailor the settings to your particular configuration and environment and you should be fine.
-
Your hardware configuration changes : You may win at the lottery and invest in your hardware or on the contrary strategic choice is imposed to you : you have to virtualise or downgrade your configuration. You may wish to know how your database will respond to this new hardware. A comparison between the 2 configurations will make you realise easily if your expactations are met.
-
It’s a perfect fit what one could call “continuous benchmarking”. (You are as wealthy as Bruce Wayne : time, money and of course a Bat-computer). A server identical to production setup upon which tests are repeated changing variables one at a time. In this scenario, difficult to suggest in a money sensitive situation, we could even imagine a (small) cluster with transactions replayed continuously with the help of a proxy or a parsed log file. We will get back to that idea in a future post.
Conclusion
As we can see, with regards to this post, pgbench-tools is an all-inclusive tool that enables you to automate and enhance reliably benchmarking while generating a fully comprehensive and complete report.
Many aspects like reproductibility, serialisation and statistics are already a leap forward in comparison to pgbench alone.
Compatibility with version 9.6 was a major issue, fixing this was paramount as v10 was coming this year (which by the way is not changed in v10 - but I will have to address that later on). I made a pull request, but it is still hanging. After months of waiting, it is still not clear if it will ever be published. I have no doubt that some more fixing is going to be needed in the coming versions.
As I found myself very interested in this tool, I decided to fork it and bring my spin to the software. I give the link again, in case you missed it earlier on : here with corrections and upgrades.
I showed you the theoretical capabilities of pgbench-tools, I will go into further details and use a practical case to show you advanced features in the coming posts.
Until then : Bench it !