Pgbench-tools - part II
GOING FURTHER
This is a translation from french. You can find the original post here
Last time, I spoke of pgbench-tools a benchmarking automatization tool. Today, we are going to see how to make a proper start and give an example. Let’s dive deeper into this tool !
Unravelling the tests - step by step
We are going to take a look at what you can expect with ./runset which starts a series of tests within a defined “set”. Everything that follows is scripted.
DB Intialisation
The first step is to create a database, here a default pgbench will work the same as:
pgbench -i
Test
Then pgbench is launched, just like a regular bench, with a previously set number of clients from the config file.
If it happens to have more than one value for the clients number in that file, a loop is performed.
A second loop is performed within, if the file contains several values for scales (please refer to the previous post for details).
Data collection
Among data collection one can find:
- speed (tps) and total amount of transactions;
latency(average, maximum and 90th percentile): the 5 worst latency values are displayed on screen for information purpuses;- the number of
checkpointsperformed during the test; - metrics regarding buffers
buf_check, buf_clean, buf_backend, buf_alloc, max_clean, backend_syncare all explained here. As well asmax_dirtyandwal_written.
Global report
An index.html file is created at the root of the folder. It contains the aformentionned graphs (tps against client number and scaling factor).
Tables containing detailled results for different sets are produced to simplify reading.
For each test of each set, another report also named index.html is generated with graphs of tps, latency, iostat, meminfo and vmstat in a sub-folder result/numberofset which can give very extended informations regarding the behaviour of server during the test.
Example
Here is what to expect in your shell after firing runset:
postgres@BENCHER pgbench-tools-master]$ ./runset
Removing old pgbench tables
DROP TABLE
VACUUM
Creating new pgbench tables
NOTICE:  table "pgbench_history" does not exist, skipping
NOTICE:  table "pgbench_tellers" does not exist, skipping
NOTICE:  table "pgbench_accounts" does not exist, skipping
NOTICE:  table "pgbench_branches" does not exist, skipping
creating tables...
100000 of 100000 tuples (100%) done (elapsed 0.03 s, remaining 0.00 s)
vacuum...
set primary keys...
done.
Run set #1 of 3 with 1 clients scale=1
Running tests using: psql -h localhost -U postgres -p 5432 -d pgbench
Storing results using: psql -h localhost -U postgres -p 5432 -d results
Found standard pgbench tables with prefix=pgbench_
Cleaning up database pgbench
TRUNCATE TABLE
VACUUM
CHECKPOINT
Waiting for checkpoint statistics
INSERT 0 1
This is test 2267
Script tpc-b_96.sql executing for 1 concurrent users...
./benchwarmer: line 249: 19127 Killed                  ./timed-os-stats vmstat > results/$TEST/vmstat.log  (wd: /var/postgres/pgbench-tools-master)
./benchwarmer: line 249: 19128 Killed                  ./timed-os-stats iostat > results/$TEST/iostat.log  (wd: /var/postgres/pgbench-tools-master)
./benchwarmer: line 249: 19129 Killed                  ./timed-os-stats meminfo > results/$TEST/meminfo.log  (wd: /var/postgres/pgbench-tools-master)
UPDATE 1
transaction type: /var/postgres/pgbench-tools-master/tests/tpc-b_96.sql
scaling factor: 1
query mode: simple
number of clients: 1
number of threads: 1
duration: 60 s
number of transactions actually processed: 32095
latency average = 1.869 ms
tps = 534.911951 (including connections establishing)
tps = 535.018561 (excluding connections establishing)
Cleaning up database pgbench
TRUNCATE TABLE
VACUUM
CHECKPOINT
Worst latency results:
43635
43909
45061
45594
1042786
Report for each test
Last time, I wrote about the set report, but this time I will focus on the test report.
Collected data are stored, sorted and grouped not only by set but also by test, in the aformentionned database which is declared in the config file (defaults results).
One can find a subfolder named after each test’s number in the main folder pgbench-tools/results.
It follows, that one can easily copy these without having to make any dump from de database itself.
At last, metrics such as vmstat, iostat and meminfo are collected into logfile in this very same folder.
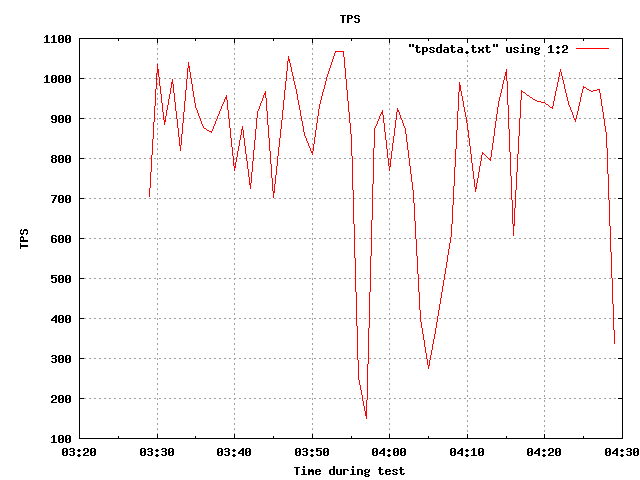
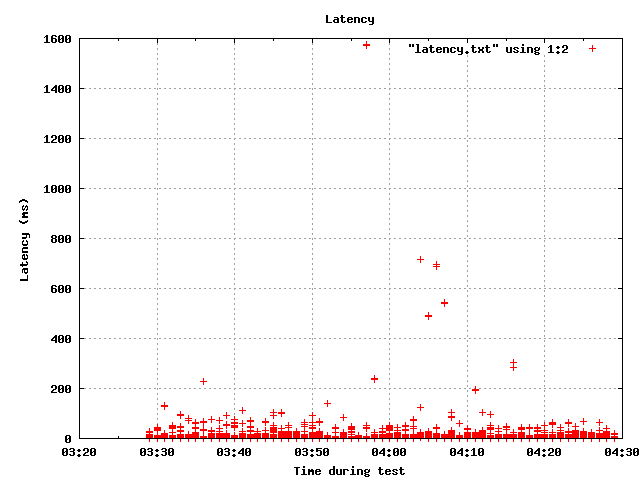
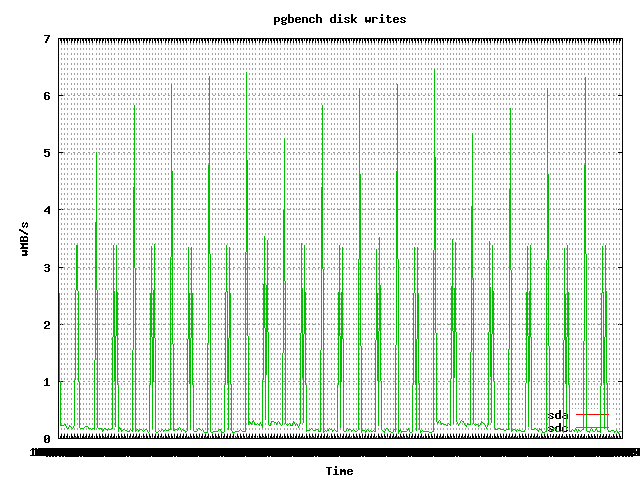
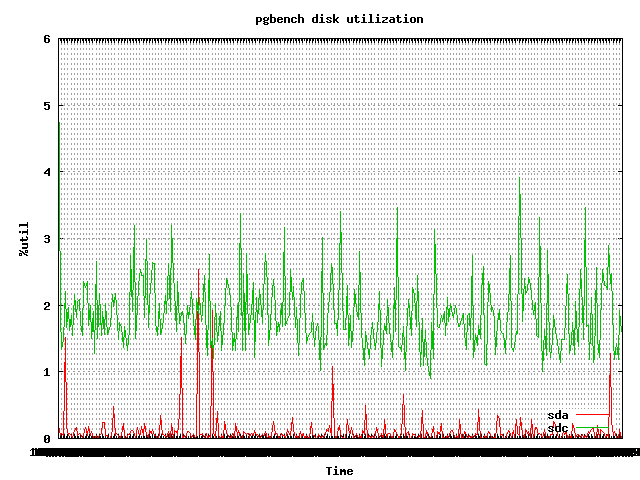
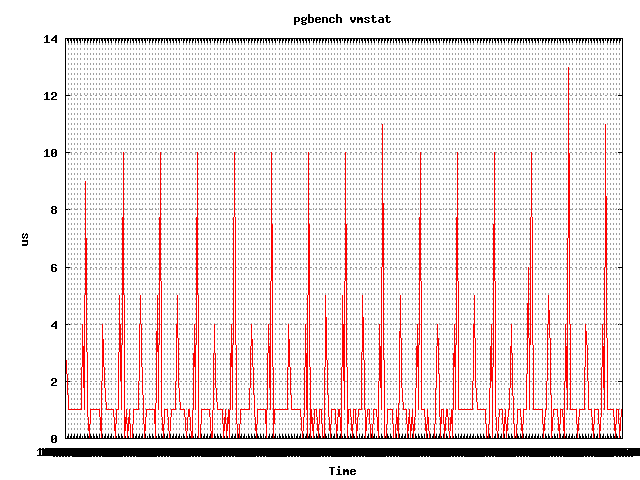
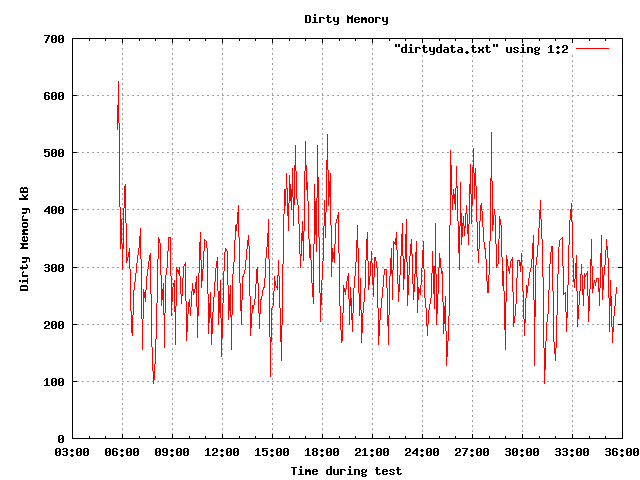
One can also find graphs showing the behaviour of tps, latency, CPU, memory, buffers and much more for each test.
We will come back to this matter and go into more details latter on.
Here is a sneak peak of graphs taken randomly.
 |
 |
 |
 |
 |
 |
The Devil is in the details
Foreword on scale, clients and the scripts used and abused
You may find relevant pieces of information on this wiki to help you further your insight on theoretical aspects of scales.
SCALE
Since rows are produced randomly, their content and structure is of little consequence. It is merely a database taken as an example. What needs to be understood here, is a given database’s size is going to fit differently in cache, memory and disk depending on your hardware. On a server with 8G of RAM and 20M cache, here is what one can expect:
| scale | matching size | data main location |
|---|---|---|
| 1 | 15Mo | shared_buffers |
| 10 | 150Mo | shared_buffers |
| 100 | 1500Mo | shared_buffers/RAM |
| 1000 | 15Go | RAM/Disk |
| 10000 | 150Go | Disk |
Here I kept the defaults SCALES=”1 10 100 1000”
Clients
Clients are simultaneus connexions expected on the cluster. I kept the defaults SETCLIENTS=”1 2 4 8 16 32”.
Type of SQL script
The type of sql script is of much importance as well.
Here is a list of what is available in the package:
- select;: Contains a transaction with a random SELECT on the PK. Perfect for replicas in Read-Only mode;
- insert INSERT of a random content ;
- insert-size: Bulk INSERT with the number of lines as parameter of input;
- update: A single transaction with an UPDATE of random value.
These last three transactions are fit for a primary which might suffer writes in different contexts.
Now mixed use cases for single clusters:
- nobranch: A transaction with a SELECT, an UPDATE and an INSERT ;
- tpc-b like: uses the standard tpc or the source site tpc-b. Which consists of 3 UPDATEs, 1 SELECT, 1 INSERT. This is the default and I kept it. It is very broad and covers much use cases.
This choice is paramount and must be chosen carefully having in mind which one is relevant to you. Size of database must be taken into account, concurrent client connexions, architecture. In my case, clusters range from few MB to 1,9TB and clients rarely exeed 32. Most instances are under the Database Administrators responsibility and are used in mixed case scenario with a single cluster. Therefore, the choice of keeping much of the defaults makes perfect sense in MY case.
Witch Hunt: The Outliers
In order to be rid of the background noise and free from artefacts, tests must be carried out throughout a long enough timeframe (a few minutes if possible). To mitigate this issue, it is also possible to run the same test several times. This way one can get an average value.
By seperating the outliers, one can obtain average values that represent a behaviour we might call “normal”. If a test fails it is advised to delete it.
Parameters used
For my first round of tests, I kept the defaults values that fit my need.
Test related parameters
- SETTIMES=3: This is the number of times the test is run (in order to mitigate the background noise e.g. unexpected checkpoints ;
- RUNTIME=60: This is the duration of a single test (option -T). It might be deemed appropriate to extend it according to the frequency of checkpoints. These have a very important effect on writes as well as reads. It is most interresting to have one or more checkpoint during a test. However performing several times the same test in a non back-to-back cycle tends to alleviate this effect.
For the first part of my test, TOTTRANS (total number of transactions) and SETRATES (target number of tps) were sidelined.
Disk related parameters
- OSDATA=1: Triggers the data collection of vmstat and iostat
- DISKLIST=”sda”: The choice of the device on which statistics are collected
Miscellaneous parameters
- report-latencies: Average latency per statement
- MAX_WORKERS=”auto”: I strongly advise keeping this one to defaults unless testing parallel query itself
VACUUM
Quick calculation will give you 4 scales (1, 10, 100, 1000), 6 values for clients (1, 2, 4, 8, 16, 32) and 3 test for each combination (SETTIMES=3) during 1 minute. The total is therefore 4 * 6 * 3=72 tests of 1 minute. Initial loading of the database is not taken into account.
Following the MVCC (management of multiple versions of a single tuple resulting of deletes and updates), all the transactions are going to leave dead tuples. Moreover, when many rows are updated (or deleted), it is also necessary to update the statistics to insure the planner always takes the best plan for every query.
To avoid autovacuum in between tests and slowing of performance, a VACUUM ANALYZE is performed if no vacuum has been done in last 10 seconds of cleanup phase of the code during the last test.
It is an approximation of course, but the downside is having too many VACUUM instead of too little. It is a sensible argument for anyone careful enough about regular VACUUMs.
Conclusion
Vacuum, reproducibility, serialization and OS/DB statistics turn pgbench-tools into an extraordinary wrapper of pgbench.
It is possible to find relevant scripts for many different use cases according to the type of test, the size of the dataset, the number of clients among other things (remaining a good approximation, of course).
However, this tool has some limitations which we are going to explore in a next - more practical - article with a complete series of test and a context set in the real world with its own constraints. I will also speak about many other aspects: interpretation of the results, the strategy underneath, and how to reach a (relatively) definitive conclusion. I will count the changes, improvements, corrections and new features on this project and they are numerous.
Until next time, keep benching guys !